Graphical of linear motion – problems and solutions
1. Graph distance (vertical) versus time (horizontal) as shown in the figure below. An object at rest shown by number…
Solution :
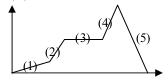
Number 3, shown by a straight line.
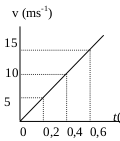
2. Graph velocity (vertical) vs time interval (horizontal) of the motion at a constant acceleration. What is the magnitude of the acceleration according to the graph?
Solution :
![]()
3. Someone traveled by car from town A to town B, shown by graph below. Vertical line as speed and horizontal line as time interval. What is the distance traveled by car during 30 minutes to 60 minutes.
Known :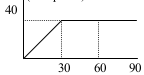
Velocity (v) = 40 km/h
Time interval (t) = 60 – 30 = 30 minutes = 0.5 hours
Wanted : Distance
Solution :
Distance = speed x time interval
Distance = (40 km/hour)(0.5 hour)
Distance = 20 km
4. Graph velocity (vertical line) versus time interval (horizontal line) informs the motion of a car from rest then moves until stop for 8 seconds, as shown in figure below.
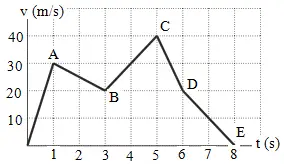
What is the distance traveled by car from 5 seconds to 8 seconds?
Solution :
Area 1 = area of triangle CD = ½ (6-5)(40-20) = ½ (1)(20) = 10
Area 2 = area of triangle DE = ½ (8-6)(20-0) = ½ (2)(20) = 20
Area 3 = Area of square = (6-5)(20-0) = (1)(20) = 20
The distance traveled by car from 5 seconds to 8 seconds = 10 + 20 + 20 = 50 meters.
5. The distance of the last 5 seconds according to graph below is ….
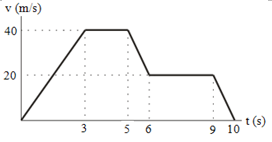
Solution :
Area 1 = area of triangle = ½ (6-5)(40-20) = ½ (1)(20) = 10
Area 2 = area of rectangle = (9-5)(20-0) = (4)(20) = 80
Area 3 = area of triangle = ½ (10-9)(20-0) = ½ (1)(20) = 10
The distance of the last 5 seconds :
10 + 80 + 10 = 100 meters
6. Graph velocity vs time interval of the non-uniform linear motion of a car.
The same acceleration occurs at…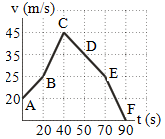
Solution :
vt = vo + a t
vt – vo = a t
a = vt – vo / t
a = acceleration, vt = final velocity, vo = initial velocity, t = time interval.
Acceleration AB = (25 – 20) / (20 – 0) = 5 / 20 = 1/4 = 0.25 m/s2
Acceleration BC = (45 – 25) / (40 – 20) = 20 / 20 = 1 m/s2
Acceleration CD = (35 – 45) / (50 – 40) = 10 / 10 = 1 m/s2
Acceleration DE = (25 – 35) / (70 – 50) = 10 / 20 = 1/2 = 0.5 m/s2
Acceleration EF = (0 – 25) / (90 – 70) = 25 / 20 = 5/4 = 1.25 m/s2
7. What is the distance traveled in 10 seconds
Known :
Initial velocity (vo) = 0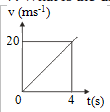
Final velocity (vt) = 20 m/s
Time interval (t) = 4 seconds
Wanted :
The distance traveled in 10 seconds
Solution :
Three equations of the motion at a constant acceleration :
vt = vo + a t
d = vo t + ½ a t2
vt2 = vo2 + 2 a d
vt = final velocity, vo = initial velocity, a = acceleration, t = time interval, d = distance
Acceleration (a) :
vt = vo + a t
20 = 0 + a (4)
20 = 4 a
a = 20 / 4
a = 5 m/s2
Distance traveled in 10 seconds :
d = vo t + ½ a t2
d = (0)(10) + ½ (5)(10)2
d = ½ (5)(100)
d = (5)(50)
d = 250 meters
8. If an object is thrown vertically upward above the surface of earth, then which is the graph of acceleration experienced by the object.
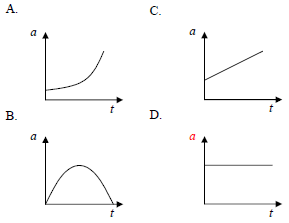
Solution
When an object moves vertically upward, the acceleration experienced by an object is acceleration due to gravity. The magnitude of acceleration due to gravity is 9.8 m/s2 and the direction of acceleration due to gravity is the to the center of Earth.
The constant acceleration is characterized by a straight line parallel to the axis t and perpendicular to the axis a.
The correct answer is D.
9. Based on the graph below, determine distance traveled by object for 20 seconds.
A. 600 m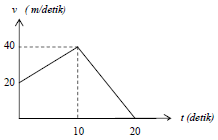
B. 500 m
C. 200 m
D. 100 m
Solution
Distance traveled during 0 – 10 seconds = area of square + area of triangle
Area of square = (20-0)(10-0) = (20)(10) = 200 meters
Area of triangle = (1/2)(10-0)(40-20) = (1/2)(10)(20) = (5)(20) = 100 meters
Distance traveled during 0 – 10 seconds = 200 meters + 100 meters = 300 meters
Distance traveled during 10 – 20 seconds = area of triangle
Area of triangle = (1/2)(20-10)(40-0) = (1/2)(10)(40) = (5)(40) = 200 meters
Distance traveled during 0 – 20 seconds :
300 meters + 200 meters = 500 meters
The correct answer is B.
10. The motion of three objects, each illustrated by the graph below.
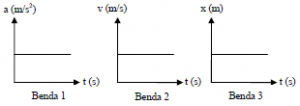
Determine the correct statement for the motion of all three objects.
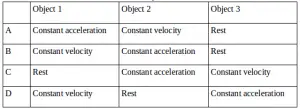
Solution :
Graph of object 1 = Graph of acceleration (a) and time interval (t)
Based on the graph, object moves at a constant acceleration. Constant acceleration indicated by a straight line perpendicular to the axis of acceleration (a).
Graph of object 2 = Graph of velocity (v) and time interval (a)
Based on the graph, the object moves at a constant velocity. Constant velocity indicated by a straight line perpendicular to the axis of velocity (v).
Graph of object 3 = Graph of displacement (x) and time (a)
Based on the graph, displacement constant or object at rest.
The correct answer is A.
11. The position of an object moving along the x-axis is shown by the following graph.
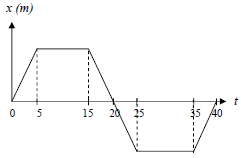
The graph shows that the object moves at a constant velocity between the time interval….
A. 5-15 seconds and 25-35 seconds
B. 0-5 seconds and 35-40 seconds
C. 15-25 seconds
D. 0-5 seconds, 15-25 seconds and 35-40 seconds
Solution :
5-15 seconds and 25-35 seconds = Object’s displacement always constant or object at rest.
0-5 seconds, 15-25 seconds and 35-40 seconds = object moves at constant velocity.
The correct answer is D.
12. The following graph shows the speed of the time function of two objects moving straight from the same starting position. After moving for t seconds both objects have the same position change. Determine the time interval and displacement of the object.
A. 5 seconds and 50 meters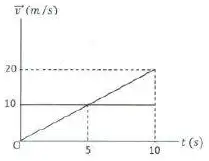
B. 5 seconds and 100 meters
C. 10 seconds and 50 meters
D. 10 seconds and 100 meters
Solution :
Graph 1 = constant acceleration
Time interval = 10 seconds
Distance = area of triangle = ½ (v)(t) = ½ (10-0)(20-0) = ½ (10)(20) = (5)(20) = 100 meters
Graph 2 = constant velocity
Time interval = 10 seconds
Distance = area of square = (v)(t) = (10-0)(10-0) = (10)(10) = 100 meters
The correct answer is D.
13. Based on graph below, the time interval when the object moves at constant acceleration and the time interval when the object is experiencing the greatest acceleration is ….
A. Between 0 and t1, and between t1 and t2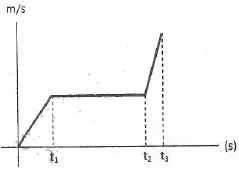
B. Between t1 and t2, and between t2 and t3
C. Between t2 and t3, and between t1 and t2
D. Between 0 and t1, and between t2 and t3
Solution :
If the graph is a straight line then the velocity is constant, if the graph is a slash then the acceleration is constant. The line is getting tilted, the acceleration is getting bigger.
0 – t1 = constant acceleration
t1 – t2 = constant velocity
t2 – t3 = constant acceleration
The correct answer is B.
1. Question: What does the slope of a position vs. time graph represent? Answer: The slope of a position vs. time graph represents the velocity of the object. A steeper slope indicates a higher velocity, while a flat (horizontal) line indicates the object is at rest.
2. Question: On a velocity vs. time graph, how do you determine the displacement of an object? Answer: The displacement of an object can be found by calculating the area under the curve (or between the curve and the x-axis) on a velocity vs. time graph.
3. Question: How can you differentiate between uniform and non-uniform motion on a position vs. time graph? Answer: In a position vs. time graph, uniform motion is represented by a straight line (constant slope), whereas non-uniform motion is depicted by a curved line, indicating that the velocity is changing over time.
4. Question: What does a horizontal line on a velocity vs. time graph indicate? Answer: A horizontal line on a velocity vs. time graph indicates that the object is moving with a constant velocity, i.e., it’s not accelerating or decelerating.
5. Question: If the velocity vs. time graph is below the time axis (negative velocity), what does it signify? Answer: If a velocity vs. time graph is below the time axis, it indicates that the object is moving in the opposite direction of the reference direction (often taken as positive).
6. Question: How is acceleration represented on a velocity vs. time graph? Answer: On a velocity vs. time graph, acceleration is represented by the slope of the graph. A positive slope indicates positive acceleration, a negative slope indicates negative acceleration (or deceleration), and a flat line indicates no acceleration.
7. Question: What does a parabolic curve on a position vs. time graph suggest? Answer: A parabolic curve on a position vs. time graph suggests that the object is under constant acceleration. The shape of the curve is quadratic, consistent with the kinematic equation .
8. Question: In a position vs. time graph, how can you determine if an object is moving forwards or backwards relative to its starting point? Answer: If the curve or line on a position vs. time graph is rising (moving upwards), it indicates the object is moving forward (or in the positive direction). If the curve or line is descending (moving downwards), it shows the object is moving backward (or in the negative direction) relative to its starting position.
9. Question: How does a free-falling object look on a velocity vs. time graph? Answer: For a free-falling object (ignoring air resistance), the velocity vs. time graph would be a straight line with a positive slope (if starting from rest) due to the constant acceleration due to gravity. The slope would represent the acceleration value, which on Earth is approximately .
10. Question: If an object is at rest, how would its acceleration vs. time graph look? Answer: For an object at rest, its acceleration vs. time graph would be a horizontal line on the time axis, indicating that the acceleration is zero throughout the duration.
