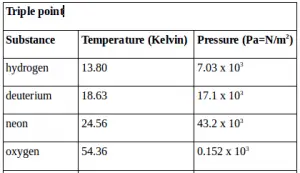
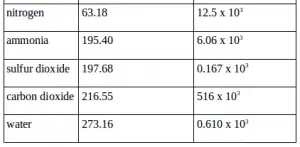
Article about Changes of phase Critical temperature Triple point
In the discussion of the ideal gas law, it has been explained that the ideal gas law describes the behavior of real gas accurately only when the pressure and density of real gas are not too large. If the pressure and real gas density are large enough, the ideal gas law provides inaccurate results, likewise, when the temperature of real gas approaches the boiling point. This is related to the interactions that occur between real gas molecules. Gas pressure is inversely proportional to gas volume. When the gas pressure is large enough, the gas volume becomes smaller. Because the gas volume is low, the distance between the gas molecules becomes closer. When the distance between molecules becomes closer, the molecules attract each other. It’s like when you put a piece of iron on a magnet. If the distance between the magnet and iron is far enough, the magnet cannot pull iron. But if the distance between magnet and iron is close, iron is drawn closer.
So gas molecules behave like a magnet. When the distance between molecules is close enough, the molecules pull together. The pulling force causes the distance between molecules to get closer (the gas volume gets smaller). Usually, this happens when the gas pressure is large enough (large pressure, low volume. Small volume, the distance between molecules is getting closer). Therefore, the ideal gas law does not provide accurate results when the pressure and density of the real gas are huge.
Diagram of Pressure vs. Volume
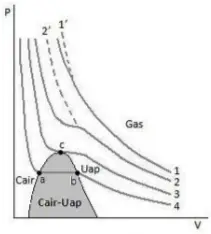 To better understand the problem above, let’s review the diagram, which states the relationship between gas pressure and volume. Curves 1, 2, 3 and 4 show the same gas behavior at different temperatures. The gas temperature shown in curve 1 is higher than curve 2. The temperature of the gas shown in curve 2 is higher than curve 3. The temperature of the gas shown in curve 3 is higher than curve 4. The curve is the slash in the middle of the diagram. The gas temperature is always fixed, which changes only the pressure (P) and the volume (V) of the gas.
According to the ideal gas law, the line starting from number 1 must end in number 1. Likewise, the line starting from number 2 must stop at number 2. The reality experienced by real gas is not by the ideal gas law forecast. When the gas pressure is large enough, the gas volume becomes smaller and deviates from the ideal gas law forecast (compare with curve 1 and curve 2). The amount of gas volume deviation also depends on temperature. If the temperature of the gas is lower and approaches the melting point, aka the boiling point (point b), the gas usually experiences a more significant volume deviation than when the temperature is higher (compare curves 1, 2, 3 and 4). Influenced by the presence of attraction between the gas molecules, as explained earlier.
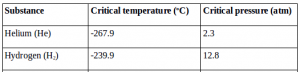
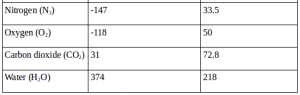
The curve 3 in the diagram above shows the behavior of a substance at its critical temperature. The point c passed by curve three is called a critical point. At temperatures higher than the critical temperature, the form of gas cannot change to a liquid form, even though it is given a considerable pressure (compare with curve 2 and curve 1). The pressure gave only makes the gas volume smaller, but cannot convert the gas to liquid. Conversely, at temperatures lower than the critical temperature, the gas will change to liquid if given an absolute pressure (compare with curve 3). The amount of pressure that can turn the gas to liquid at a critical temperature is known as the critical pressure. Each substance has a different critical temperature and critical pressure.
The curve 4 in the diagram above shows the process of changing from gas to liquid. The shaded area (resembling a mountain) is an area where gas and liquid are in equilibrium. At first, the gas volume is large. After the gas pressure increases, the gas volume becomes smaller until it reaches point b (point b is the melting point, aka the boiling point). When it arrives at point b, the gas starts to turn into liquid. During the process of changing the gas to liquid (from point b to point a), the volume of the substance becomes smaller even though there is no increase in pressure (marked with a straight line). At point a, all gases have turned into liquid. After arriving at point a adding pressure to the substance only results in a minimal volume change (marked by a very steep curve).
In everyday life, we often use the terms steam and gas. For example, water vapor or nitrogen gas. We hardly ever refer to water vapor as water gas, even though water vapor is gas from water. Likewise with nitrogen, oxygen, etc. Nitrogen or oxygen is commonly referred to as gas. Gas and steam have different meanings. If the gas from a substance is below the critical temperature of the material, then we call it steam. Conversely, if the gas from a substance is above the critical temperature of the substance, then we call it a gas.
Diagram of pressure vs. Temperature (Phase Diagram)
 Previously described the behavior of substances, using a diagram of pressure vs. Volume. In addition to using the P V diagram, the behavior of substances can be explained using the diagram of pressure (P) vs. Temperature (T). PT diagrams are commonly referred to as phase diagrams. Called a phase diagram because this diagram is used to compare the phase of a substance. One of the substances that often changes phase is water.
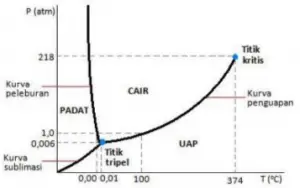
There are three curves on the diagram, namely evaporation curves, melting curves and sublimation curves.
The evaporation curve shows the points where the liquid and vapor are in equilibrium. The point where the liquid and vapor form is in equilibrium is called the melting point, aka the boiling point (called the melting point because at this point steam can melt and change into water. Called the boiling point because at this point water can boil and turn into steam) Thus, the evaporation curve actually is a graph that states the relationship between pressure (P) and boiling point / melting temperature. It appears that the smaller the pressure, the lower the temperature of the boiling point of the water, or the higher the pressure, the higher the temperature of the boiling point of the water. At a pressure of 1 atm, the boiling point temperature of the water is 100 oC. Conversely, at a pressure of 218 atm, the boiling point temperature of water = 374 oC.
218 atm pressure is also called the critical pressure of water, while the temperature of 374 oC is also called the critical temperature of water. If the vapor temperature is less than 374 oC, then steam can change its phase to liquid if it is given a pressure of 374 oC. Pressure cannot turn the steam into a liquid if the temperature is higher than 218 oC.
The melting curve shows the points where the liquid and solid are in equilibrium. The point where liquid and solid are in equilibrium is called the melting point or freezing point (called the melting point because at this point ice can melt into water. Called a freezing point because, at this point, water can freeze into ice). Thus, the melting curve is a graph that states the relationship between pressure (P) and melting point or freezing temperature. At a pressure of 1 atm, the freezing point of water (or the melting point of ice) = 0 oC. In contrast to the pressure of 218 atm, the freezing point of water (or melting point of ice) is less than 0 oC. Note that at a pressure of 1 atm, water is in liquid if the temperature is between 0 oC and 100 oC. Water is in the solid if, at a pressure of 1 atm, the temperature is less than 0 oC or water is in the steam if, at a pressure of 1 atm, the temperature exceeds 100 oC.
The sublimation curve shows the points where solid, and vapor are in equilibrium The point at which solid and steam in 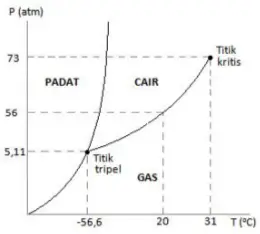 equilibrium are called the sublimation point. Thus, the sublimation curve is a graph that states the relationship between pressure (P) and the temperature of the sublimation point. Sublimation is the process of changing solid into steam, without passing through a liquid. Usually, sublimation only occurs at low pressure. Ice can just sublimate if the temperature is less than 0.01 oC and the pressure is less than 0.006 atm. The point where the three curves intersect is called the triple point.
Below is a phase diagram for carbon dioxide. Note that the scale on the water phase diagram and the carbon dioxide phase diagram are not linear.

