Zane-zanen motsi na layi - matsaloli da mafita
1. Zana tazara (tsaye) da lokaci (a kwance) kamar yadda aka nuna a cikin hoton da ke ƙasa. Wani abu da aka huta da lamba…
Magani:
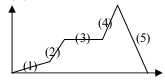
Lamba ta 3, wadda aka nuna ta hanyar layi madaidaiciya.
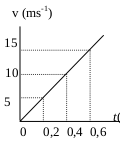
2. Saurin jadawali (tsaye) da tazara ta lokaci (kwance) na motsi a cikin hanzari akai-akai . Menene girman hanzari bisa ga jadawalin?
Magani:

3. Wani ya yi tafiya da mota daga garin A zuwa garin B, wanda aka nuna ta hanyar jadawali a ƙasa. Layin tsaye kamar gudu da layin kwance kamar tazara. Menene nisan da mota ta yi tsakanin mintuna 30 zuwa mintuna 60.
An sani: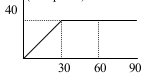
Gudun (v) = 40 km/h
Tazarar lokaci (t) = 60 – 30 = mintuna 30 = awanni 0.5
Ana nema: Nisa
Magani:
Nisa = gudu x tazara lokaci
Nisa = (kilomita 40/awa)(awa 0.5)
Nisa = 20 km
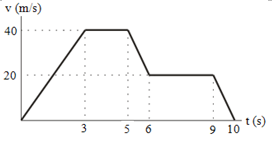
4. Jadawalin saurin (layin tsaye) idan aka kwatanta da tazara tsakanin lokaci (layin kwance) yana sanar da motsin mota daga hutawa sannan ya motsa har sai ta tsaya na tsawon daƙiƙa 8, kamar yadda aka nuna a hoton da ke ƙasa.
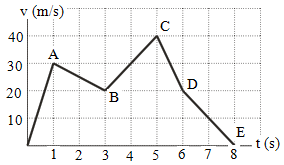
Menene nisan da mota ke yi daga daƙiƙa 5 zuwa daƙiƙa 8?
Magani:
Yanki na 1 = yankin CD mai kusurwa uku = ½ (6-5)(40-20) = ½ (1)(20) = 10
Yanki 2 = yanki na triangle DE = ½ (8-6) (20-0) = ½ (2) (20) = 20
Yanki na 3 = Yankin murabba'i = (6-5)(20-0) = (1)(20) = 20
Nisa da mota ta yi daga daƙiƙa 5 zuwa daƙiƙa 8 = 10 + 20 + 20 = mita 50.
5. Nisa na daƙiƙa 5 na ƙarshe bisa ga jadawalin da ke ƙasa shine ….
Magani:
Yanki na 1 = yankin alwatika = ½ (6-5)(40-20) = ½ (1)(20) = 10
Yanki na 2 = yankin murabba'i mai kusurwa uku = (9-5)(20-0) = (4)(20) = 80
Yanki na 3 = yankin alwatika = ½ (10-9)(20-0) = ½ (1)(20) = 10
Nisa na daƙiƙa 5 na ƙarshe s:
10 + 80 + 10 = mita 100
6. Zana saurin da tazarar lokaci na motsi mara daidaito na mota.
Haka hanzarin yana faruwa a…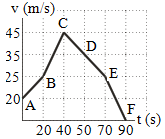
Magani:
v t = v o + a
v t – v o = a
a = v t – v o / t
a = hanzari, v t = saurin ƙarshe, v o = saurin farko, t = tazara tsakanin lokaci.
Hanzarta AB = (25 – 20) / (20 – 0) = 5 / 20 = 1/4 = 0.25 m/s 2
Hanzarta BC = (45 – 25) / (40 – 20) = 20/20 = 1 m/s 2
Faifan CD mai sauri = (35 – 45) / (50 – 40) = 10 / 10 = 1 m/s 2
Hanzarta DE = (25 – 35) / (70 – 50) = 10 / 20 = 1/2 = 0.5 m/s 2
Hanzarta EF = (0 – 25) / (90 – 70) = 25/20 = 5/4 = 1.25 m/s 2
7. Menene nisan da aka yi tafiya a cikin daƙiƙa 10?
An sani:
Saurin farko (v)o) = 0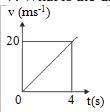
Saurin ƙarshe (v t ) = 20 m/s
Tazarar lokaci (t) = daƙiƙa 4
Ana so:
Nisa da aka yi a cikin daƙiƙa 10
Magani:
Daidaito uku na motsi a cikin hanzari akai-akai:
v t = v o + a
d = v o t + ½ a 2
v t 2 = v o 2 + 2 talla
v t = saurin ƙarshe, v o = saurin farko, a = hanzari, t = tazara ta lokaci, d = nisa
Hanzarta (a):
v t = v o + a
20 = 0 + a (4)
20 = 4 a
a = 20/4
a = 5 m/s 2
Nisa da aka yi a cikin daƙiƙa 10:
d = v o t + ½ a 2
d = (0)(10) + ½ (5)(10) 2
d = ½ (5)(100)
d = (5)(50)
d = mita 250
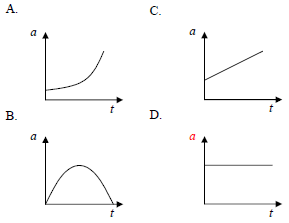
8. Idan aka jefa wani abu a tsaye sama da saman duniya, to wannan shine jadawalin hanzarin da abin ya fuskanta.
Magani
Idan abu ya motsa a tsaye sama, saurin da abu ke samu shine saurin da yake samu saboda nauyi. Girman saurin da yake samu saboda nauyi shine 9.8 m/s 2 kuma alkiblar saurin da yake samu saboda nauyi yana zuwa tsakiyar Duniya.
Ana siffanta saurin gudu akai-akai ta hanyar layi madaidaiciya wanda ke layi ɗaya da axis na t kuma yana tsaye da axis.
Amsar da ta dace ita ce D.
9. Dangane da jadawalin da ke ƙasa, ƙayyade nisan da abu ya yi tafiya na daƙiƙa 20.
A. 600 m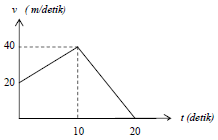
B. 500 m
C. mita 200
D. 100 m
Magani
Nisa da aka yi tafiya a cikin daƙiƙa 0 - 10 = yankin murabba'i + yankin alwatika
Faɗin murabba'i = (20-0)(10-0) = (20)(10) = mita 200
Yankin alwatika = (1/2)(10-0)(40-20) = (1/2)(10)(20) = (5)(20) = mita 100
Nisa da aka yi a cikin daƙiƙa 0 – 10 = mita 200 + mita 100 = mita 300
Nisa da aka yi tafiya a cikin daƙiƙa 10 - 20 = yankin alwatika
Yankin alwatika = (1/2)(20-10)(40-0) = (1/2)(10)(40) = (5)(40) = mita 200
Nisa da aka yi a cikin daƙiƙa 0 - 20:
Mita 300 + mita 200 = mita 500
Amsar da ta dace ita ce B.
10. Motsin abubuwa uku, kowannensu an kwatanta shi da jadawalin da ke ƙasa.
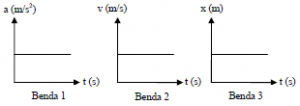
Kayyade daidai bayanin motsi na dukkan abubuwa uku.
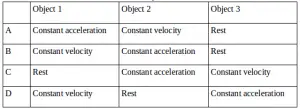
Magani:
Jadawalin abu na 1 = Jadawalin hanzari (a) da tazara ta lokaci (t)
Dangane da jadawalin, abu yana motsawa a cikin hanzarin da ba ya canzawa. Saurin hanzari akai-akai wanda aka nuna ta hanyar layi madaidaiciya a tsaye zuwa ga axis na hanzari (a).
Jadawalin abu na 2 = Jadawalin gudu (v) da tazara lokaci (a)
Dangane da jadawalin, abin yana motsawa a cikin gudu mai ɗorewa. Gudun da aka saba gani ta hanyar layi madaidaiciya wanda aka nuna a tsaye zuwa ga axis na saurin (v).
Jadawalin abu na 3 = Jadawalin matsar (x) da lokaci (a)
Dangane da jadawalin, ma'aunin motsi ko abu a lokacin hutawa.
Amsar da ta dace ita ce A.
11. An nuna matsayin wani abu da ke tafiya tare da axis ɗin x ta hanyar jadawalin da ke ƙasa.
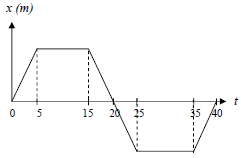
Jadawalin yana nuna cewa abin yana motsawa a daidai lokacin gudu tsakanin tazara….
A. Daƙiƙa 5-15 da daƙiƙa 25-35
B. Daƙiƙa 0-5 da daƙiƙa 35-40
C. Daƙiƙa 15-25
D. Daƙiƙa 0-5, daƙiƙa 15-25 da daƙiƙa 35-40
Magani:
Daƙiƙa 5-15 da daƙiƙa 25-35 = Matsar da abu koyaushe yana nan ko kuma abu yana hutawa.
Daƙiƙa 0-5, daƙiƙa 15-25 da daƙiƙa 35-40 = motsi abu a saurin da ba ya canzawa.
Amsar da ta dace ita ce D.
12. Jadawalin da ke ƙasa yana nuna saurin aikin lokaci na abubuwa biyu da ke motsawa kai tsaye daga wuri ɗaya na farawa. Bayan motsi na daƙiƙa biyu, dukkan abubuwa suna da canjin matsayi iri ɗaya. Kayyade tazara da kuma canjin abin.
A. Daƙiƙa 5 da mita 50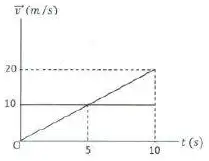
B. Daƙiƙa 5 da mita 100
C. Daƙiƙa 10 da mita 50
D. Daƙiƙa 10 da mita 100
Magani:
Jadawali na 1 = hanzari akai-akai
Tazarar lokaci = daƙiƙa 10
Nisa = yankin alwatika = ½ (v)(t) = ½ (10-0)(20-0) = ½ (10)(20) = (5)(20) = mita 100
Jadawali na 2 = saurin da ya dace
Tazarar lokaci = daƙiƙa 10
Nisa = yankin murabba'i = (v)(t) = (10-0)(10-0) = (10)(10) = mita 100
Amsar da ta dace ita ce D.
13. Dangane da jadawalin da ke ƙasa, tazarar lokacin da abin ke motsawa a hankali da kuma tazarar lokacin da abin ke fuskantar mafi girman hanzari shine ....
A. Tsakanin 0 da t1, kuma tsakanin t1 da t2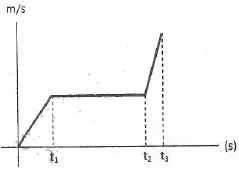
B. Tsakanin t 1 da t 2 , da kuma tsakanin t 2 da t 3
C. Tsakanin t 2 da t 3 , da kuma tsakanin t 1 da t 2
D. Tsakanin 0 da t 1 , da kuma tsakanin t 2 da t 3
Magani:
Idan jadawalin layi madaidaiciya ne to saurin yana nan, idan jadawalin yanki ne to saurin yana nan. Layin yana karkata, saurin yana ƙara girma.
0 – t 1 = hanzari akai-akai
t 1 – t 2 = saurin gudu akai-akai
t 2 – t 3 = hanzari akai-akai
Amsar da ta dace ita ce B.
1. Tambaya: Menene gangaren matsayi da jadawalin lokaci ke wakilta? Amsa: Gangar matsayi da jadawalin lokaci yana wakiltar saurin abu. Gangar mai tsayi yana nuna saurin abu mafi girma, yayin da layin lebur (a kwance) yana nuna cewa abu yana hutawa.
2. Tambaya: A kan jadawalin gudu da lokaci, ta yaya ake tantance wurin da wani abu ya motsa? Amsa: Ana iya gano wurin da wani abu ya motsa ta hanyar ƙididdige yankin da ke ƙarƙashin lanƙwasa (ko tsakanin lanƙwasa da axis na x) a kan jadawalin gudu da lokaci.
3. Tambaya: Ta yaya za ku iya bambance tsakanin motsi iri ɗaya da wanda ba iri ɗaya ba a kan jadawalin matsayi da lokaci? Amsa: A cikin jadawalin matsayi da lokaci, motsi iri ɗaya ana wakiltar shi ta hanyar layi madaidaiciya (gefen da ba ya canzawa), yayin da motsi mara iri ɗaya ana nuna shi ta hanyar layi mai lanƙwasa, wanda ke nuna cewa saurin yana canzawa akan lokaci.
4. Tambaya: Menene layin kwance akan saurin da jadawalin lokaci ke nunawa? Amsa: Layin kwance akan jadawalin gudu da jadawalin lokaci yana nuna cewa abu yana motsawa da saurin da ba ya canzawa, watau, ba ya hanzartawa ko raguwa.
5. Tambaya: Idan jadawalin gudu da lokaci yana ƙasa da axis na lokaci (negative speed), me yake nufi? Amsa: Idan jadawalin gudu da lokaci yana ƙasa da axis na lokaci, yana nuna cewa abu yana motsawa a akasin alkiblar tunani (sau da yawa ana ɗaukarsa a matsayin mai kyau).
6. Tambaya: Ta yaya ake wakiltar hanzari a jadawalin gudu da lokaci? Amsa: A jadawalin gudu da lokaci, hanzari ana wakilta shi da gangaren jadawalin. Zurfin kyau yana nuna hanzari mai kyau, gangaren mara kyau yana nuna hanzari mara kyau (ko raguwa), kuma layi mai faɗi yana nuna babu hanzari.
7. Tambaya: Menene lanƙwasa parabolic akan matsayi da jadawalin lokaci ke nunawa? Amsa: Lanƙwasa parabolic akan jadawalin matsayi da lokaci yana nuna cewa abin yana ƙarƙashin hanzari akai-akai. Siffar lanƙwasa tana da kusurwa huɗu, daidai da lissafin kinematic .
8. Tambaya: A cikin jadawalin matsayi da lokaci, ta yaya za ku iya tantance ko wani abu yana tafiya gaba ko baya dangane da wurin farawarsa? Amsa: Idan lanƙwasa ko layi yana kan matsayi da jadawalin lokaci yana tashi (yana tafiya sama), yana nuna cewa abin yana tafiya gaba (ko kuma a cikin alkibla mai kyau). Idan lanƙwasa ko layin yana saukowa (yana tafiya ƙasa), yana nuna cewa abin yana tafiya baya (ko kuma a cikin alkibla mara kyau) dangane da matsayinsa na farawa.
9. Tambaya: Ta yaya abu mai faɗuwa daga nesa yake kama da jadawalin gudu da lokaci? Amsa: Ga abu mai faɗuwa daga nesa (yin watsi da juriyar iska), jadawalin gudu da lokaci zai zama layi madaidaiciya tare da gangara mai kyau (idan ya fara daga hutawa) saboda saurin gudu akai-akai saboda nauyi. Gangaren zai wakilci ƙimar hanzari, wanda a Duniya yake kimanin .
10. Tambaya: Idan abu yana hutawa, ta yaya saurinsa zai kasance idan aka kwatanta da jadawalin lokaci? Amsa: Ga abu a hutawa, jadawalin hanzarinsa idan aka kwatanta da jadawalin lokaci zai zama layi a kwance a kan ma'aunin lokaci, wanda ke nuna cewa saurin gudu sifili ne a tsawon lokacin.
