Grafika linearnog kretanja – problemi i rješenja
1. Nacrtajte grafikon zavisnosti udaljenosti (vertikalno) od vremena (horizontalno) kao što je prikazano na slici ispod. Objekat u mirovanju prikazan je brojem…
Rešenje:
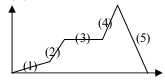
Broj 3, prikazan pravom linijom.
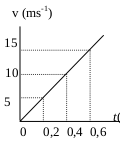
2. Grafik brzine (vertikalne) u odnosu na vremenski interval (horizontalni) kretanja pri konstantnom ubrzanju . Kolika je veličina ubrzanja prema grafiku?
Rešenje:

3. Neko je putovao automobilom od grada A do grada B, što je prikazano na grafiku ispod. Vertikalna linija predstavlja brzinu, a horizontalna linija vremenski interval. Kolika je pređena udaljenost automobilom za 30 minuta do 60 minuta?
Poznato: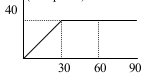
Brzina (v) = 40 km/h
Vremenski interval (t) = 60 – 30 = 30 minuta = 0.5 sati
Traži se: Udaljenost
Rešenje:
Udaljenost = brzina x vremenski interval
Udaljenost = (40 km/h)(0.5 sati)
Udaljenost = 20 km
4. Grafik brzine (vertikalna linija) u odnosu na vremenski interval (horizontalna linija) prikazuje kretanje automobila iz mirovanja , a zatim se kreće do zaustavljanja u trajanju od 8 sekundi, kao što je prikazano na slici ispod.
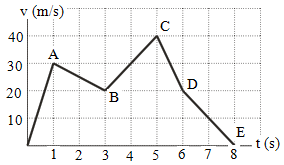
Kolika je udaljenost koju je automobil prešao od 5 do 8 sekundi?
Rešenje:
Površina 1 = površina trougla CD = ½ (6-5)(40-20) = ½ (1)(20) = 10
Površina 2 = površina trougla DE = ½ (8-6) (20-0) = ½ (2) (20) = 20
Površina 3 = Površina kvadrata = (6-5)(20-0) = (1)(20) = 20
Pređena udaljenost automobilom od 5 sekundi do 8 sekundi = 10 + 20 + 20 = 50 metara.
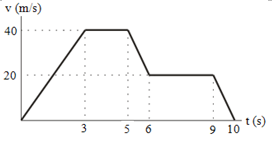
5. Udaljenost u posljednjih 5 sekundi prema donjem grafikonu je ….
Rešenje:
Površina 1 = površina trougla = ½ (6-5)(40-20) = ½ (1)(20) = 10
Površina 2 = površina pravougaonika = (9-5)(20-0) = (4)(20) = 80
Površina 3 = površina trougla = ½ (10-9)(20-0) = ½ (1)(20) = 10
Udaljenost u posljednjih 5 sekundi :
10 + 80 + 10 = 100 metara
6. Grafik brzine u odnosu na vremenski interval neravnomjernog linearnog kretanja automobila.
Isto ubrzanje se javlja pri…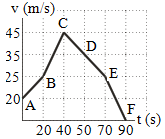
Rešenje:
v t = v o + pri
v t – v o = pri
a = v t – v o / t
a = ubrzanje, vt = konačna brzina, vo = početna brzina, t = vremenski interval.
Ubrzanje AB = (25 – 20) / (20 – 0) = 5 / 20 = 1/4 = 0.25 m/ s²
Ubrzanje BC = (45 – 25) / (40 – 20) = 20 / 20 = 1 m/ s²
Ubrzanje CD = (35 – 45) / (50 – 40) = 10 / 10 = 1 m/ s²
Ubrzanje DE = (25 – 35) / (70 – 50) = 10 / 20 = 1/2 = 0.5 m/ s²
Ubrzanje EF = (0 – 25) / (90 – 70) = 25 / 20 = 5/4 = 1.25 m/ s²
7. Kolika je pređena udaljenost za 10 sekundi
Poznato:
Početna brzina (vo) = 0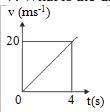
Konačna brzina (vt ) = 20 m/s
Vremenski interval (t) = 4 sekundi
Traži se:
Pređena udaljenost za 10 sekundi
Rešenje:
Tri jednačine kretanja pri konstantnom ubrzanju:
v t = v o + pri
d = v o t + ½ u tački 2
v t 2 = v o 2 + 2 ad
v t = konačna brzina, v o = početna brzina, a = ubrzanje, t = vremenski interval, d = udaljenost
Ubrzanje (a):
v t = v o + pri
20 = 0 + a (4)
20 = 4 a
a = 20 / 4
a = 5 m/ s²
Pređena udaljenost za 10 sekundi:
d = v o t + ½ u tački 2
d = (0)(10) + ½ (5)(10) ²
d = ½ (5)(100)
d = (5)(50)
d = 250 metara
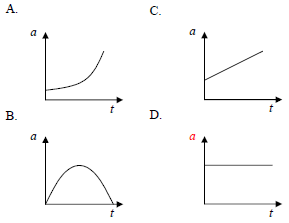
8. Ako se objekt baci vertikalno prema gore iznad površine Zemlje, koji je onda grafik ubrzanja koje objekt doživljava?
rastvor
Kada se objekat kreće vertikalno prema gore, ubrzanje koje objekat doživljava je ubrzanje usljed gravitacije. Veličina ubrzanja usljed gravitacije je 9.8 m/s² , a smjer ubrzanja usljed gravitacije je prema centru Zemlje.
Konstantno ubrzanje karakterizira prava linija paralelna s t-osom i okomita na a-osu.
Tačan odgovor je D.
9. Na osnovu donjeg grafikona, odredite pređenu udaljenost objekta za 20 sekundi.
A. 600 m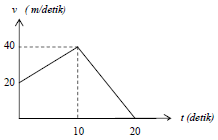
B. 500 m
C. 200 m
D. 100 m
rastvor
Pređena udaljenost za 0 – 10 sekundi = površina kvadrata + površina trougla
Površina kvadrata = (20-0)(10-0) = (20)(10) = 200 metara
Površina trougla = (1/2)(10-0)(40-20) = (1/2)(10)(20) = (5)(20) = 100 metara
Pređena udaljenost za 0 – 10 sekundi = 200 metara + 100 metara = 300 metara
Pređena udaljenost za 10 – 20 sekundi = površina trougla
Površina trougla = (1/2)(20-10)(40-0) = (1/2)(10)(40) = (5)(40) = 200 metara
Pređena udaljenost za 0 – 20 sekundi:
300 metara + 200 metara = 500 metara
Tačan odgovor je B.
10. Kretanje tri objekta, svaki ilustrovan grafikom ispod.
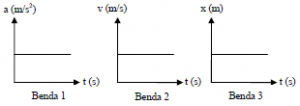
Odredite tačnu tvrdnju za kretanje sva tri objekta.
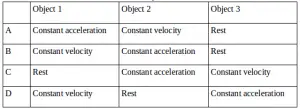
Rešenje:
Grafik objekta 1 = Grafik ubrzanja (a) i vremenskog intervala (t)
Na osnovu grafika, objekat se kreće konstantnim ubrzanjem. Konstantno ubrzanje je označeno pravom linijom okomitom na osu ubrzanja (a).
Grafik objekta 2 = Grafik brzine (v) i vremenskog intervala (a)
Na osnovu grafikona, objekat se kreće konstantnom brzinom. Konstantna brzina je označena pravom linijom okomitom na osu brzine (v).
Grafikon objekta 3 = Grafikon pomjeranja (x) i vremena (a)
Na osnovu grafa, konstanta pomjeranja ili objekt u mirovanju.
Tačan odgovor je A.
11. Položaj objekta koji se kreće duž x-ose prikazan je sljedećim grafikom.
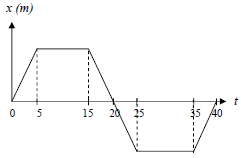
Grafikon pokazuje da se objekt kreće konstantnom brzinom između vremenskog intervala….
A. 5-15 sekundi i 25-35 sekundi
B. 0-5 sekundi i 35-40 sekundi
C. 15-25 sekundi
D. 0-5 sekundi, 15-25 sekundi i 35-40 sekundi
Rešenje:
5-15 sekundi i 25-35 sekundi = Pomjeranje objekta je uvijek konstantno ili objekt miruje.
0-5 sekundi, 15-25 sekundi i 35-40 sekundi = objekat se kreće konstantnom brzinom.
Tačan odgovor je D.
12. Sljedeći grafik prikazuje brzinu vremenske funkcije dva objekta koja se kreću pravolinijski iz iste početne pozicije. Nakon kretanja od t sekundi, oba objekta imaju istu promjenu položaja. Odredite vremenski interval i pomjeranje objekta.
A. 5 sekundi i 50 metara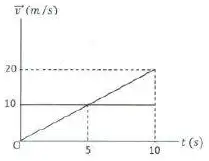
B. 5 sekundi i 100 metara
C. 10 sekundi i 50 metara
D. 10 sekundi i 100 metara
Rešenje:
Grafikon 1 = konstantno ubrzanje
Vremenski interval = 10 sekundi
Udaljenost = površina trougla = ½ (v)(t) = ½ (10-0)(20-0) = ½ (10)(20) = (5)(20) = 100 metara
Grafikon 2 = konstantna brzina
Vremenski interval = 10 sekundi
Udaljenost = površina kvadrata = (v)(t) = (10-0)(10-0) = (10)(10) = 100 metara
Tačan odgovor je D.
13. Na osnovu donjeg grafikona, vremenski interval kada se objekat kreće konstantnim ubrzanjem i vremenski interval kada objekat doživljava najveće ubrzanje je ...
A. Između 0 i t1, i između t1 i t2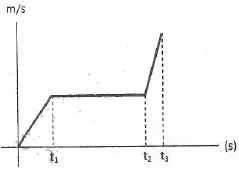
B. Između t1 i t2 , i između t2 i t3
C. Između t2 i t3 , i između t1 i t2
D. Između 0 i t1 , i između t2 i t3
Rešenje:
Ako je grafik prava linija, onda je brzina konstantna, ako je grafik kosa linija, onda je ubrzanje konstantno. Linija se naginje, ubrzanje se povećava.
0 – t 1 = konstantno ubrzanje
t1 – t2 = konstantna brzina
t² – t³ = konstantno ubrzanje
Tačan odgovor je B.
1. Pitanje: Šta predstavlja nagib grafikona položaja u odnosu na vrijeme? Odgovor: Nagib grafikona položaja u odnosu na vrijeme predstavlja brzinu objekta. Strmiji nagib označava veću brzinu, dok ravna (horizontalna) linija označava da je objekt u mirovanju.
2. Pitanje: Na grafiku brzine u odnosu na vrijeme, kako se određuje pomjeranje objekta? Odgovor: Pomjeranje objekta može se izračunati izračunavanjem površine ispod krive (ili između krive i x-ose) na grafiku brzine u odnosu na vrijeme.
3. Pitanje: Kako možete razlikovati uniformno i neuniformno kretanje na grafiku položaja u odnosu na vrijeme? Odgovor: Na grafiku položaja u odnosu na vrijeme, uniformno kretanje je predstavljeno pravom linijom (konstantni nagib), dok je neuniformno kretanje prikazano zakrivljenom linijom, što ukazuje na to da se brzina mijenja tokom vremena.
4. Pitanje: Šta označava horizontalna linija na grafiku brzine u odnosu na vrijeme? Odgovor: Horizontalna linija na grafiku brzine u odnosu na vrijeme označava da se objekat kreće konstantnom brzinom, tj. da ne ubrzava niti usporava.
5. Pitanje: Ako se grafik brzine u odnosu na vrijeme nalazi ispod vremenske ose (negativna brzina), šta to znači? Odgovor: Ako se grafik brzine u odnosu na vrijeme nalazi ispod vremenske ose, to ukazuje na to da se objekat kreće u suprotnom smjeru od referentnog smjera (često se uzima kao pozitivan).
6. Pitanje: Kako se ubrzanje predstavlja na grafiku brzine u odnosu na vrijeme? Odgovor: Na grafiku brzine u odnosu na vrijeme, ubrzanje je predstavljeno nagibom grafikona. Pozitivan nagib označava pozitivno ubrzanje, negativni nagib označava negativno ubrzanje (ili usporavanje), a ravna linija označava da nema ubrzanja.
7. Pitanje: Šta sugerira parabolična krivulja na grafiku položaja u odnosu na vrijeme? Odgovor: Parabolična krivulja na grafiku položaja u odnosu na vrijeme sugerira da je objekt pod konstantnim ubrzanjem. Oblik krivulje je kvadratni, što je u skladu s kinematičkom jednačinom .
8. Pitanje: Na grafiku položaja u odnosu na vrijeme, kako možete utvrditi da li se objekat kreće naprijed ili nazad u odnosu na svoju početnu tačku? Odgovor: Ako je kriva ili linija na grafiku položaja u odnosu na vrijeme u porastu (kreće se prema gore), to ukazuje na to da se objekat kreće naprijed (ili u pozitivnom smjeru). Ako je kriva ili linija u padu (kreće se prema dolje), to pokazuje da se objekat kreće unazad (ili u negativnom smjeru) u odnosu na svoju početnu poziciju.
9. Pitanje: Kako objekt u slobodnom padu izgleda na grafiku brzine u odnosu na vrijeme? Odgovor: Za objekt u slobodnom padu (zanemarujući otpor zraka), grafik brzine u odnosu na vrijeme bio bi prava linija s pozitivnim nagibom (ako se kreće iz mirovanja) zbog konstantnog ubrzanja usljed gravitacije. Nagib bi predstavljao vrijednost ubrzanja, koja je na Zemlji približno
10. Pitanje: Ako objekt miruje, kako bi izgledao grafik ubrzanja u odnosu na vrijeme? Odgovor: Za objekt u mirovanju, grafik ubrzanja u odnosu na vrijeme bio bi horizontalna linija na vremenskoj osi, što ukazuje da je ubrzanje nula tokom cijelog trajanja.
